

Property Economics 101: How Supply & Demand Shape UK Property Prices

tower, bridge, london, thames, england, london, london, london, london, london

A definitive guide for buyers, sellers and investors who want to understand what really drives the UK housing market.

Understanding the UK property market fundamentals and what drives price is very important. Whether you are a first-time buyer, home owner looking to sell your property or a seasoned investor understanding the core drivers of housing costs is essential for navigating the current landscape. At the heart of every price fluctuation lies a simple yet powerful economic relationship: the balance between availability and desire.

In this guide, we break down the UK property market fundamentals-specifically how the interplay of supply and demand continues to shape property prices across the country, regardless of broader economic shifts.

Most people approach the UK property market armed with headlines, opinions and predictions — but without a framework to interpret what’s actually happening beneath the noise.

This guide gives you that framework.

It explains the forces that shape prices, why the UK behaves differently from many other markets, and what this means for your decisions as a buyer, seller or investor.
At its core, the UK housing market is driven by one principle:

When demand rises faster than supply — and supply cannot adjust quickly — prices increase.

Everything else is detail when it comes to understanding the UK property market fundamentals.

What “Supply” Really Means in the UK Property Sector —
And Why It Moves Slowly

Supply is the total number of homes available to buy or rent at any given time. In the UK, this includes:

• Existing homes for sale
• Rental stock
• New‑build homes in the pipeline
• Land with planning permission
The crucial point is this:

Housing supply is slow, rigid and heavily constrained.

Even when demand surges, supply cannot respond quickly because:

• Planning permission takes years
• The green belt restricts expansion
• Infrastructure limits where development can occur
• Labour and materials shortages slow delivery
• Developers build cautiously to avoid flooding the market

This is why UK supply tends to move in long, shallow cycles, not sharp spikes.

KEY TAKEAWAY!

Supply in housing doesn’t adjust overnight. Even when there’s political will, it takes years for planning, financing and construction to turn into completed homes. That’s why changes in supply tend to show up as slow-moving trends rather than sharp spikes or drops.

Because supply adjusts slowly, short‑term shocks (like interest rate changes) affect prices far more than new‑build delivery. This is why UK house prices rarely collapse — supply simply cannot expand fast enough to meet demand.

How the Supply Cycle Has Actually Behaved, and What it Means!

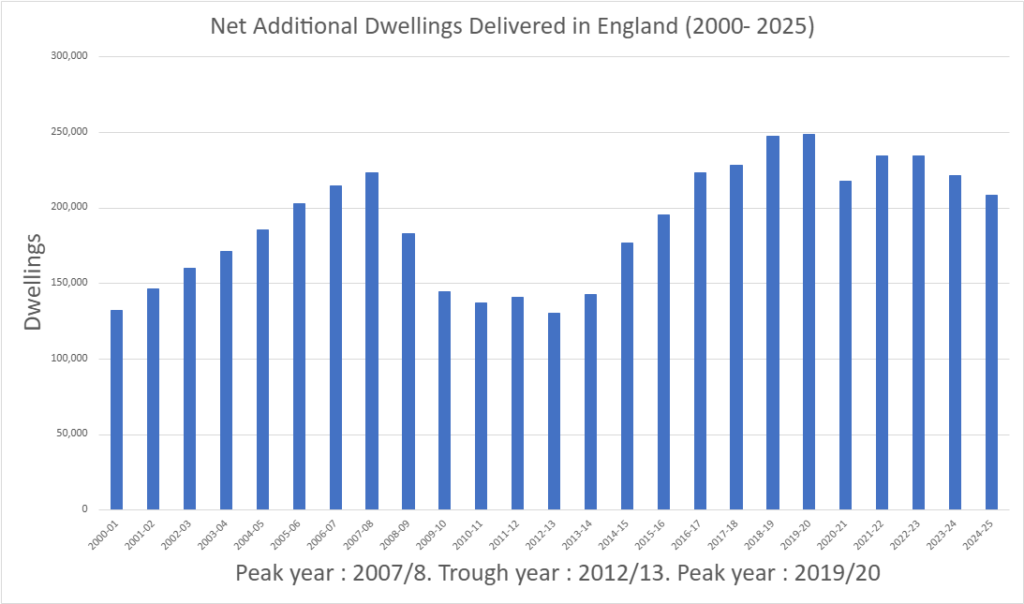
DLUHC (2025). Housing supply: net additional dwellings, England. Table 1: Net additional dwellings.
The chart above shows the number of net additional dwellings in England each year. You can see supply rising gradually through the 2010s, peaking at around 248,000 homes in 2019–20, and then drifting back towards the 200,000–210,000 range in recent years, rather than collapsing or surging in response to a single headline.
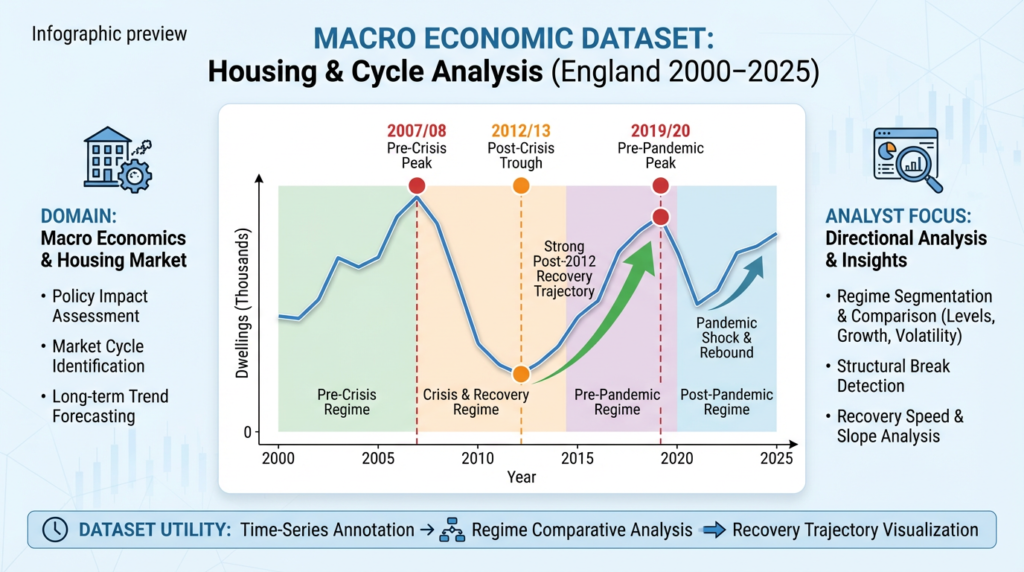
1. Pre‑Crisis Growth (2000–2007)

132k → 223k A strong, uninterrupted rise in completions and net additions.

2. Crisis & Decline (2007–2013)

223k → 130k A sharp fall followed by multi‑year stagnation and slow recovery.

3. Recovery & Expansion (2013–2020)

130k → 248k A long, consistent upswing as credit conditions normalised and development restarted.

4. Post‑Pandemic Softening (2020–2025)

248k → 208k A decline, partial rebound, then plateau as rates rose and construction costs surged.

These phases match the real-world constraints of the development cycle: supply responds, but with a long lag.

Why This Matters for Landlords & Property Investors

Slow supply = strong price and rental resilience

Because supply cannot expand quickly, short‑term shocks (like rate hikes) hit prices and transactions, not the number of homes. This is why UK house prices rarely collapse: supply simply cannot surge to meet demand.

Undersupply creates long‑run pricing power

When supply grows slowly — or falls — landlords benefit from:

  • stronger rental demand

  • lower void risk

  • faster rent growth

  • reduced competition from new stock

  • higher long‑term capital appreciation

 Supply cycles help investors time the market

Understanding which regime the market is in helps investors decide when to:

  • acquire (during stagnation or early recovery)

  • refinance (during strong growth phases)

  • dispose (near peaks when supply is rising)

Policy shocks matter — but through the pipeline

Planning reform, tax changes, EPC rules, Help to Buy, or rate changes don’t change supply instantly. They change future delivery, which investors can anticipate years ahead.

Supply data is a leading indicator of rental pressure
  • Falling net additions today = tighter rental markets tomorrow.
  • Rising net additions = future competition and softer rent growth.

Housing supply is slow, sticky and structurally constrained — it cannot adjust overnight. That’s why the market moves in long cycles rather than sudden shifts, and why shocks affect prices far more than the number of homes built.

For landlords and investors, understanding these supply regimes is critical: slow supply growth underpins rental resilience, supports long‑term capital appreciation, and helps investors position themselves ahead of the next structural shift in the housing cycle.

What “Demand” Means in the UK Property Sector —
And Why It Can Change Overnight

Demand is the number of people who want to buy or rent homes, and how much they can afford to pay.

Demand typically rises when:

  • Population grows or household formation increases (e.g. more people living alone)

  • Local job markets strengthen and wages rise

  • Credit is easily available and mortgage products are competitive

  • Interest rates fall, making monthly payments more affordable

  • Areas are regenerated and become more attractive (transport links, amenities, schools)

Demand typically falls when:

  • Interest rates rise and mortgage payments jump

  • Affordability weakens relative to incomes

  • Lenders tighten criteria (e.g. stress tests, deposit requirements)

  • Economic confidence drops or unemployment rises

WHAT THIS MEANS?

Demand is the fast‑moving side of the market. It explains why prices can flatten or fall even when the UK still has a long‑term housing shortage.

How Supply and Demand Interact — The Real Price Mechanism

Economists describe the market using two curves:

• Demand curve: slopes downward — people buy less when prices rise
• Supply curve: slopes upward — developers build more when prices rise

But in UK housing, supply is inelastic — it barely moves.

So when demand rises (population growth, low rates, strong jobs), prices rise sharply.
When demand falls (rate hikes, recession), prices soften — but rarely collapse — because supply doesn’t surge.

SO WHAT?

The UK’s structurally tight supply means downturns tend to be shallow and recoveries tend to be strong. This is why long‑run price growth has been consistently upward.

Government policies – such as stamp duty changes, Help to Buy‑style schemes or rental regulation – can also temporarily boost or dampen demand in specific segments.

What is “Supply and Demand” in UK Property?

Economists often use a simple diagram:

  • The demand curve slopes down (people buy less when prices are higher)

  • The supply curve slopes up (developers are more willing to build when prices are higher)

  • The point where the two curves meet is the market price and quantity.

When demand increases (shift of the demand curve to the right) and supply does not move much, the new intersection is at a higher price. When demand weakens, prices tend to stabilise or soften, and transaction volumes can fall.

Economists often use a simple diagram:

  • The demand curve slopes down (people buy less when prices are higher)

  • The supply curve slopes up (developers are more willing to build when prices are higher)

  • The point where the two curves meet is the market price and quantity.

When demand increases (shift of the demand curve to the right) and supply does not move much, the new intersection is at a higher price. When demand weakens, prices tend to stabilise or soften, and transaction volumes can fall.

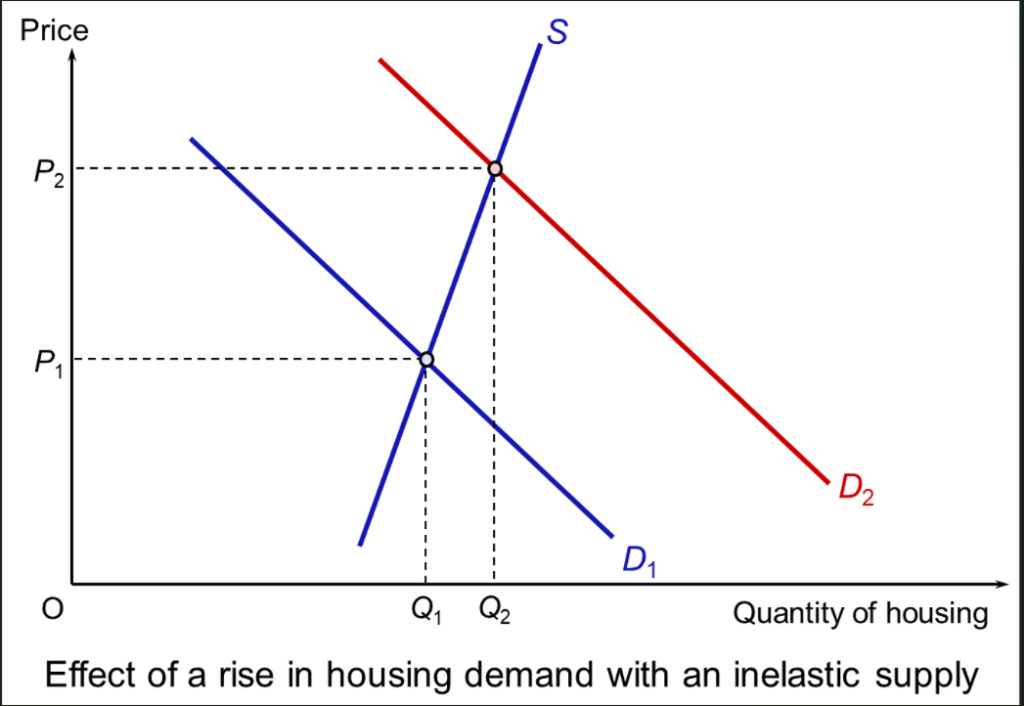
This diagram shows what happens when housing demand rises in a market where supply cannot expand quickly. The steep supply curve S reflects the UK’s inelastic housing supply — planning constraints, limited land and long build times mean the number of homes barely increases even when demand grows.

When the demand curve shifts from D₁ to D₂, the result is a sharp rise in prices (from P₁ to P₂) but only a small increase in the number of homes sold (from Q₁ to Q₂).

In other words, when supply is tight, even modest increases in demand push prices up significantly — a core feature of the UK housing market.

Why UK Property Prices Tend to Rise Over Decades

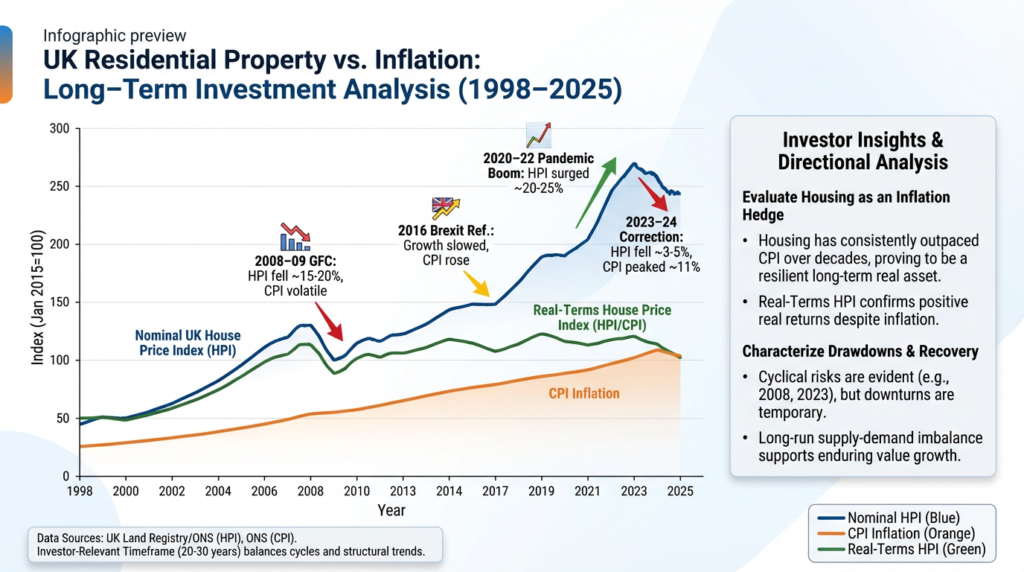
Over the past 25–30 years, UK house prices have consistently outpaced inflation. Even after adjusting for CPI, real‑terms house prices have risen significantly.

This long‑run trend is driven by:

  • Persistent undersupply
  • Population growth
  • Rising household formation
  • Strong labour markets in key regions
  • Planning constraints
  • Limited land availability

Short‑term corrections happen — 2008–09, 2023–24 — but the structural imbalance remains.

WHAT THIS MEANS!

The long‑run upward trend is not an accident. It is the predictable result of chronic undersupply meeting steady demand. This is why UK housing has historically been a strong inflation hedge and a resilient long‑term asset

“Over the past 25–30 years, UK house prices have consistently outpaced general inflation, demonstrating the long‑term resilience of residential property as a real asset. While short‑term corrections occur — notably during the 2008 financial crisis and the 2023–24 interest‑rate shock — the long‑run trajectory remains upward.

When deflated by CPI, the real‑terms house price index still shows substantial appreciation, underpinned by chronic undersupply, population growth, and structural demand.

This long‑run divergence between HPI and CPI highlights the role of housing as an effective inflation hedge and a durable store of value for investors.”

The Growing Gap Between Supply and Demand

You can think of the UK housing problem as a gap that keeps reopening:

  • Demand is supported by population growth, household formation and long‑term aspirations for home ownership.

  • Supply lags because of planning, land constraints and viability issues for developers, especially when costs are high and regulations tighten.

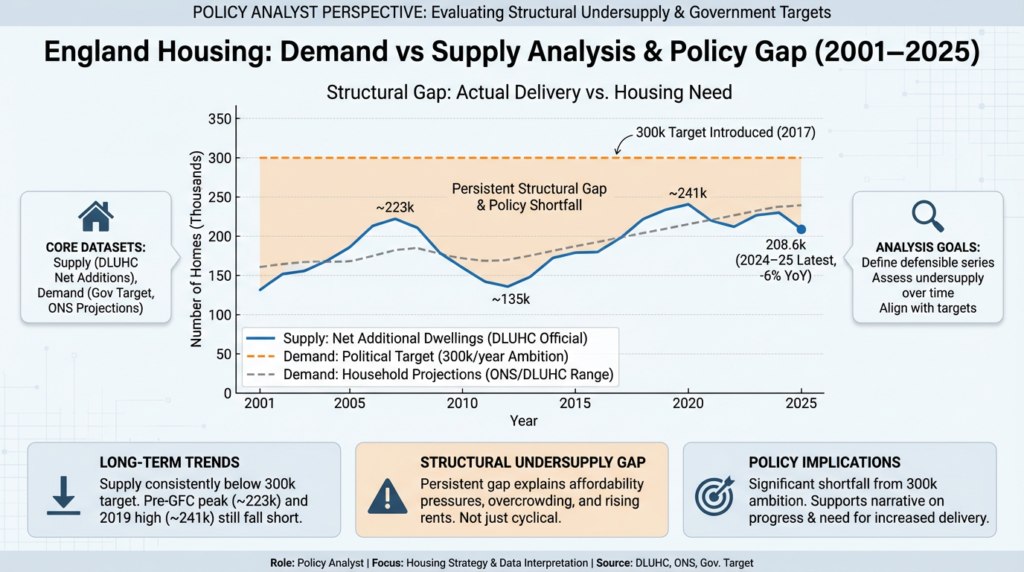
England adds roughly 200,000–250,000 net additional homes per year. Household projections suggest long‑run need is also above current delivery. Government ambitions are closer to 300,000. This gap has persisted for decades. Even when demand cools temporarily — such as during interest rate spikes — the underlying shortage does not disappear.

WHAT THIS MEANS FOR YOU!

The structural gap explains why forecasts for the mid‑2020s expect modest growth or flat prices, not a deep collapse. The shortage acts as a floor under the market.

This diagram illustrates the long‑running gap between the number of homes England actually delivers each year and the level of housing need implied by government targets and household projections. The blue line shows net additional dwellings, which have consistently remained below both the 300,000‑homes‑per‑year ambition and the underlying demographic demand. Even in peak years, supply never reaches the target, creating a persistent structural shortfall. This widening gap helps explain rising affordability pressures, overcrowding and rental inflation — and shows that the UK’s housing challenge is not cyclical, but rooted in long‑term undersupply.

Regional Differences — Why Location Matters More Than National Averages

The UK is not one market. It is dozens of micro‑markets with different supply constraints and demand drivers.

Examples:

• Prime London: extremely constrained supply + global demand
• Regional growth cities: regeneration + strong job markets
• Some smaller towns: more elastic supply + localised demand

WHY THIS IS IMPORTANT!

National averages hide local realities. Your risk and opportunity depend on the specific supply‑demand balance in the area you’re buying, selling or investing in.

Rental Growth vs New Housing Delivery Across English Regions
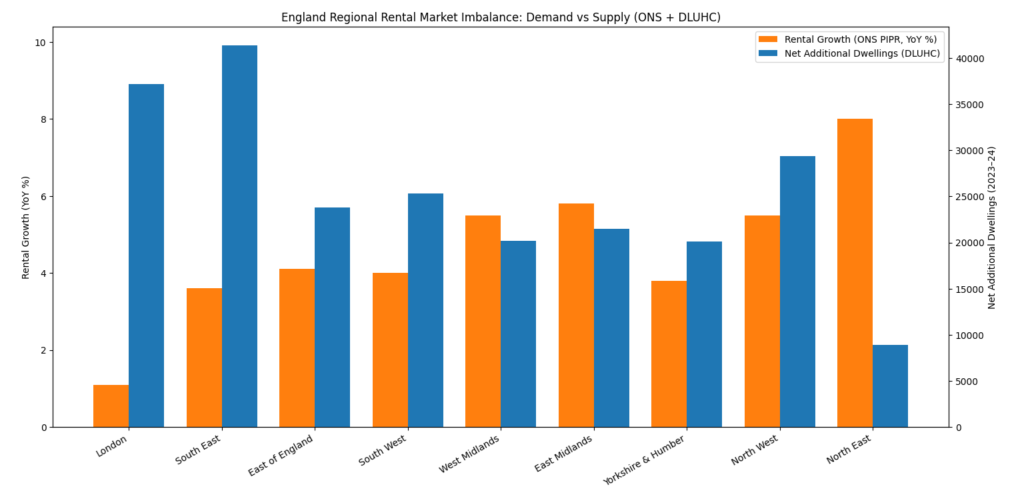
(ONS PIPR YoY % & DLUHC Net Additions 2023–24)

High Demand, Low Supply: The Structural Forces Driving England’s Rental Market

England’s rental market is being shaped by a widening imbalance between demand and supply, and the latest ONS and DLUHC data makes that pattern unambiguous. Regions such as the North East, West Midlands and North West are seeing some of the fastest rental growth in the country, yet they continue to deliver relatively low levels of new housing, intensifying pressure on rents.

By contrast, London and the South East are adding the largest number of new dwellings, but rental growth remains far more subdued, reflecting a better‑supplied market.

This divergence highlights a structural issue: areas with the strongest rental inflation are often those delivering the least new stock, creating persistent affordability challenges and reinforcing the case for targeted investment and development in undersupplied regions.

Interest Rates — The Fastest Lever in the System

Interest rates, in the housing market usually means mortgage rates – the cost of borrowing to buy a home- do not change the number of homes, but they dramatically change affordability. That’s why it’s the fastest and most powerful short-term driver of the housing cycle.

But mortgage rates don’t exist on it’s own. It’s heavily shaped by the Bank of England (BoE) Base Rate, which is the anchor for the entire UK financial system.

BoE Base Rate = the price of money for banks
Mortgage Rate = the price of money for households
They are not identical, but they are tightly linked.

When rates fall:

• Buyers can borrow more
• Demand rises
• Prices and transactions increase
• Confidence returns

When rates rise:

• Affordability tightens
• Demand cools, transactions slow down
• Prices flatten or fall
• Development slows, reducing future supply

SO WHAT?

Interest rates drive short‑term cycles, and explain why the market moves from year to year.

Supply drives long‑term trends. Understanding both helps you time decisions without being misled by headlines.

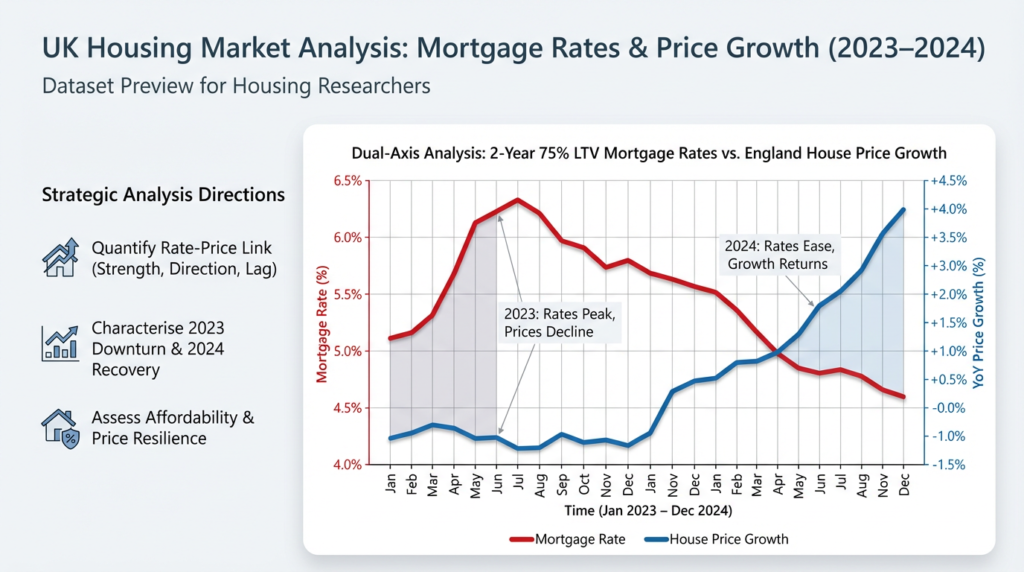
This diagram illustrates the relationship between UK mortgage rates and house price growth during 2023–2024. The red line tracks the average 2‑year 75% LTV mortgage rate, while the blue line shows year‑on‑year house price growth. As the chart highlights, when mortgage rates peaked in 2023, price growth turned negative as affordability weakened and buyer demand cooled. As rates eased through 2024, price growth recovered, reflecting renewed confidence and improved affordability. The diagram demonstrates a clear inverse relationship: shifts in borrowing costs are one of the strongest short‑term drivers of house price movements in the UK.

Supply — The Slow, Structural Force

Unlike interest rates, supply moves slowly. Planning constraints, land availability, build‑out rates and local policy shape the long‑run trajectory of house prices.

The diagrams above show that even when rates fall and demand rebounds, the market can only grow sustainably if supply keeps pace. When supply is constrained — as in much of the South East — even small demand shifts can push prices sharply higher.

Supply determines the long‑term trend; rates determine the short‑term swings.

Supply explains the trajectory

Why some areas recover faster.
Why certain postcodes  remain resilient.
Why long‑run price growth persists despite downturns.

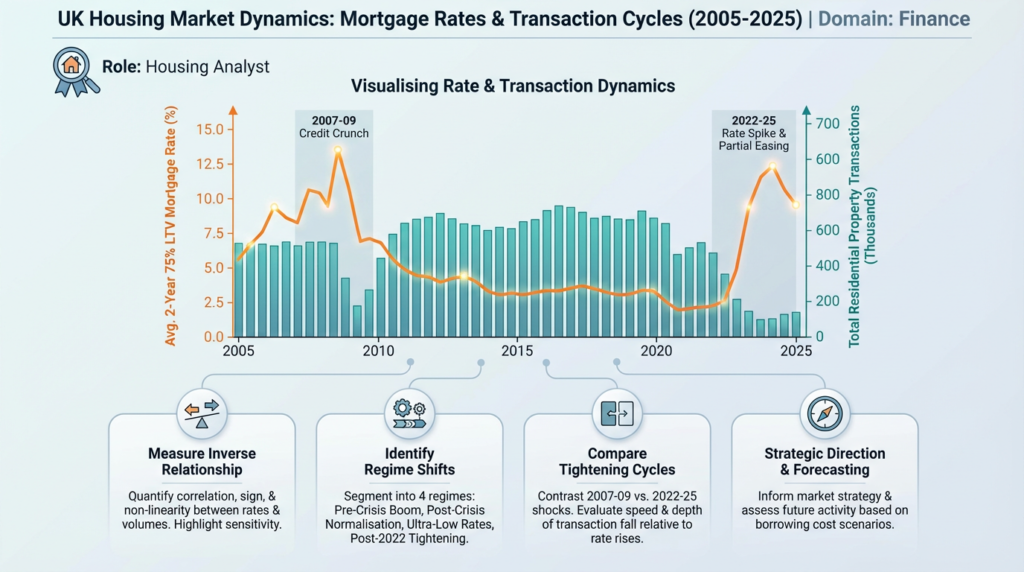
This diagram shows how UK mortgage rates and housing transactions move in opposite directions over time. The orange line tracks the average 2‑year 75% LTV mortgage rate, while the teal bars show the number of residential property transactions. When rates spike — as during the 2007–09 credit crunch and again from 2022 onwards — transaction volumes fall sharply, reflecting reduced affordability and weaker buyer confidence. When rates ease, activity begins to recover. The chart highlights a clear inverse relationship: borrowing costs are one of the strongest short‑term drivers of market activity, shaping how quickly homes sell and how many buyers are active at any given time.

The Simple Property Economics Test

Before any major property decision, ask:

1. Is supply limited here?

Planning constraints? Land scarcity? Slow pipelines?

2. What drives demand here?

Jobs? Transport? Schools? Regeneration?

3. What could change either one?

Interest rates? Local employers? New developments? Policy shifts?

WHAT THIS MEANS FOR YOU!

If you can answer these three questions confidently, you understand more about the market than most participants — and you dramatically reduce your risk.

Conclusion: The UK Housing Market Is Not a Mystery — It’s a System

Once you understand supply and demand, the UK property market fundamentals  become predictable:

• Supply is slow and constrained
• Demand is fast and cyclical
• Prices rise when demand exceeds supply
• Prices soften when demand cools
• Long‑run growth is driven by structural undersupply

This guide gives you the framework.

Use it to interpret headlines, make better decisions, and understand where the market is heading — not just where it has been.

Featured Articles

The Landlord’s Market Playbook

The Blueprint Advantage: A Core Guide to Rental Markets & returns The UK rental market outlook for landlords operate at the intersection of rental demand, supply constraints, mortgage costs, and...

Leeds Property Investment Outlook

Why a 26‑Year Supply–Demand Gap Is Reshaping Returns When UK investors talk about “northern powerhouses,” Leeds is always near the top of the list—and for good reason. It combines strong economic...

Oxford Property Investment Outlook

Oxford’s 2026 Market Reset Oxford’s property investment outlook enters 2026 with a rare combination of increased housing supply, persistent structural undersupply, and record rental...

The Investor’s Guide to UK Housing Supply, Demand & Long‑Run Value

A data‑driven framework for identifying resilient markets, pricing risk, and allocating capital with confidence The UK housing market investment framework is often described as unpredictable — but for...

How Supply & Demand Determine Your Sale Price — And How to Use It to Your Advantage

A strategic guide for UK homeowners who want to sell smarter, faster, and for the right price. Price right and sell fast. However, selling a home isn’t about guessing the “right” price or waiting for...

What UK Buyers Need to Know About Supply, Demand & Timing Your Purchase

A practical, data‑driven guide for homebuyers who want to make smarter decisions in a complex market. Buying a home in the UK can feel overwhelming — headlines contradict each other, prices move...

Property Economics 101: How Supply & Demand Shape UK Property Prices

A definitive guide for buyers, sellers and investors who want to understand what really drives the UK housing market. Understanding the UK property market fundamentals and what drives price is very...

Yield vs Void: The Hidden Trade‑Off Every UK Property Investor Must Understand

High Yield Isn’t the Full Story — Void Risk Changes Everything Many UK property investors chase high‑yield areas believing they offer superior cash flow. On paper, a 9–10% yield looks irresistible...

How to Position Your Property Portfolio – Yield Vs Growth

Cash Flow vs. Capital: Which Master Do You Serve For many property investors, the ultimate debate isn’t about where to buy, but why to buy. Every property you add to your portfolio serves one of...