

A practical, data‑driven guide for homebuyers who want to make smarter decisions in a complex market.
This is a UK property market guide for buyers. Buying a home in the UK can feel overwhelming — headlines contradict each other, prices move unpredictably, and interest rates seem to change the rules overnight. But beneath the noise, the housing market follows a simple logic:
Prices move when demand changes faster than supply — and supply in the UK barely moves at all.
Once you understand this, the market becomes far easier to read.
This UK property market guide for buyers gives you the essential tools to judge when to buy, where to buy, and what risks to watch.
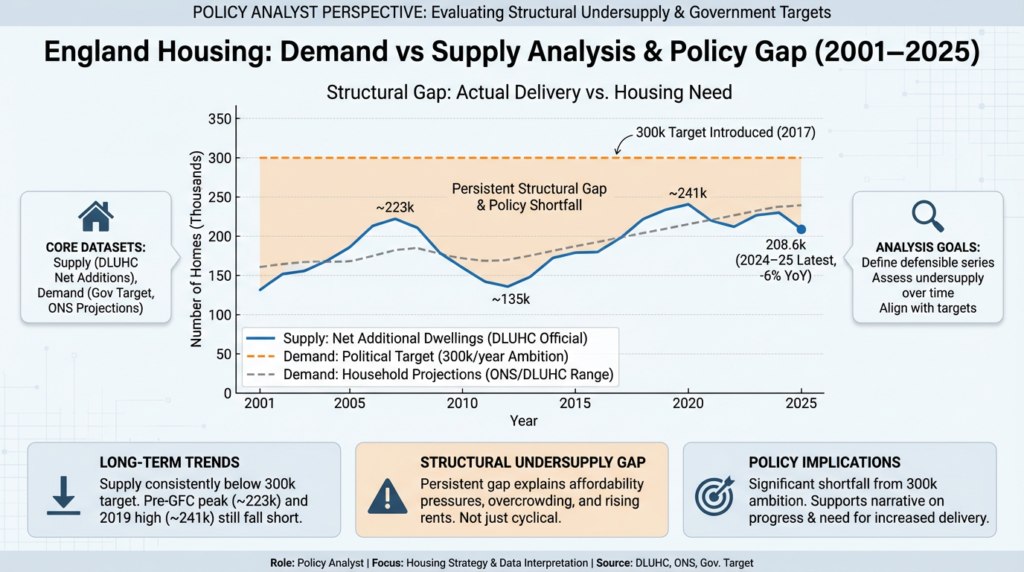
Why Supply Matters — And Why It’s Your Safety Net
UK housing supply is slow, rigid, and heavily constrained.
It takes years to plan, finance and build homes, and many areas simply cannot expand due to:
• Green belt restrictions
• Planning delays
• Infrastructure limits
• Developer viability constraints
SO WHAT FOR BUYERS?
• Supply rarely surges, so even when prices soften, they tend not to collapse.
• Areas with tight supply (London, Oxford, Bristol, Manchester core) hold value better.
• Buying in a constrained area reduces long‑term downside risk.
Why Demand Moves Fast — And Why It Affects Your Timing
Demand can change overnight because it’s driven by:
• Interest rates
• Mortgage affordability
• Wage growth
• Employment confidence
• Buyer sentiment
When rates fall → demand rises → competition increases.
When rates rise → demand cools → buyers gain negotiating power.
WHAT DOES THIS MEAN FOR BUYERS?
• Your timing advantage comes from demand cycles, not supply cycles.
• Dips in demand (e.g., after rate hikes), means you will face fewer competing buyers.
• When demand surges, expect bidding wars and reduced negotiation leverage.
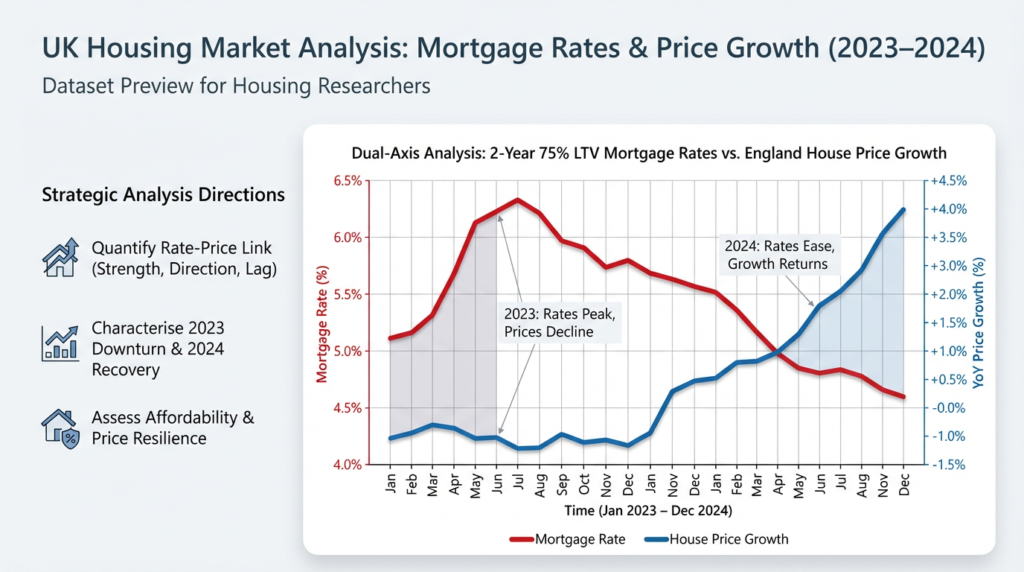
This diagram illustrates the relationship between UK mortgage rates and house price growth during 2023–2024. The red line tracks the average 2‑year 75% LTV mortgage rate, while the blue line shows year‑on‑year house price growth. As the chart highlights, when mortgage rates peaked in 2023, price growth turned negative as affordability weakened and buyer demand cooled. As rates eased through 2024, price growth recovered, reflecting renewed confidence and improved affordability. The diagram demonstrates a clear inverse relationship: shifts in borrowing costs are one of the strongest short‑term drivers of house price movements in the UK.
Real‑Terms Prices: The Hidden Trend Buyers Miss
The nominal prices can fall — but real‑terms prices (adjusted for inflation) tell the deeper story.
Over the past 25–30 years:
• Nominal prices rose strongly
• CPI inflation rose steadily
• Real‑terms house prices still increased significantly
This means housing has historically outperformed inflation.
BENEFITS FOR BUYERS?
• Short‑term dips are normal — but long‑term value tends to rise.
• Buying during a dip often means capturing long‑run real growth.
• Real‑terms analysis helps you avoid being misled by headline price drops.
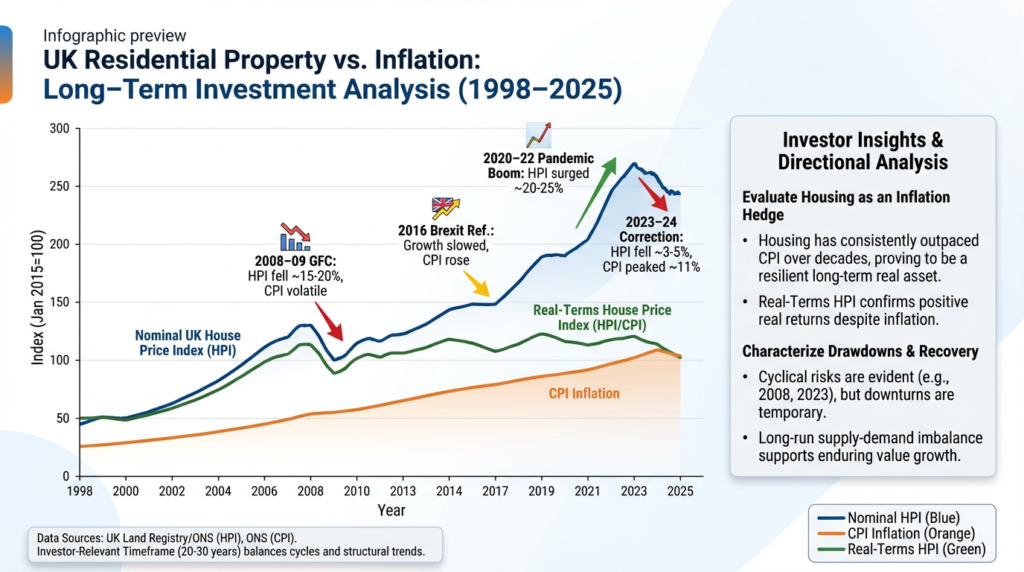
This diagram compares UK house prices with inflation over the past two decades, showing how property has performed both in cash terms and after adjusting for rising prices. By plotting nominal HPI, CPI inflation, and a real‑terms house‑price index, the chart highlights how major events such as the financial crisis, Brexit and the pandemic shaped the market. The visual makes clear that, despite cyclical downturns, UK housing has consistently outpaced inflation over the long run, reinforcing its role as a resilient real asset.
Local Supply Constraints — The Most Important Factor in Choosing Where to Buy
National averages hide the real story.
Your risk and opportunity depend on local supply constraints.
Areas with tight supply:
- Limited land
- Strict planning
- High demand from jobs/transport
- Strong long‑term fundamentals
Examples: London, Oxford, Cambridge, Bristol, Manchester city centre.
Areas with elastic supply:
- More land
- Easier planning
- More new‑build capacity
Examples: Some Midlands towns, parts of the North East.
SO WHAT FOR BUYERS?
- Tight‑supply areas hold value better and recover faster after downturns.
- Elastic‑supply areas may offer better short‑term affordability but weaker long‑term growth.
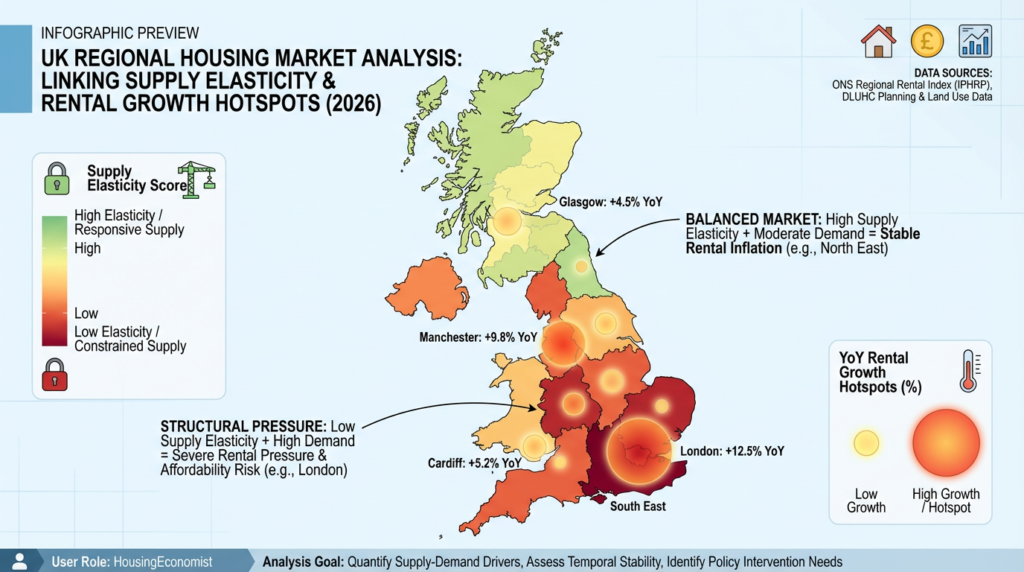
The diagram maps rental‑growth hotspots onto regional supply‑elasticity scores to show where demand pressure is colliding with constrained housing supply. Regions shaded red have low supply elasticity, meaning they struggle to build enough homes, while the overlaid circles highlight where rents are rising fastest. Together, the visual reveals the areas facing the greatest structural pressure — such as London and parts of the North West — and contrasts them with more balanced markets where supply can respond more easily to demand.
Buyer Psychology: The Invisible Force That Moves Prices
Buyer sentiment often shifts long before any visible change appears in the supply data. This is because there are emotions involved. Markets are not just economics.
Demand rises when:
- Headlines turn positive
- Rates fall confidence strengthens
- “Fear of missing out” returns as households secure a home before prices surge.
- Transaction volumes rise households expect better value later in the year
Demand falls when:
- Mortgage rates increase
- Media coverage becomes more negative
- Buyers expect future price drops later in the year
These swings in sentiment happen far faster than any adjustment in construction pipelines or planning approvals. As a result, the market can feel overheated or subdued even when underlying supply remains broadly stable.
BUYERS SHOULD UNDERSTAND?
- The best buying conditions often occur when sentiment is negative.
- When everyone else is fearful, competition is low and negotiation power is high.
- When sentiment turns positive, prices often rise before the headlines catch up.
Timing Your Purchase — A Practical Framework
Here is a simple, evidence‑based timing model:
✔ Best time to buy
- Rates have recently risen
- Demand is cooling
- Listings are rising
- Sellers are more flexible
- Price growth is flat or slightly negative
✔ Neutral time to buy
- Rates are stable
- Demand is steady
- Prices are moving sideways
✔ Hardest time to buy
- Rates are falling
- Demand is surging
- Competition is high
- Bidding wars are common
- Prices are rising month‑on‑month
SO WHAT’S IN THE BUYERS INTEREST?
You don’t need to “time the bottom”.
Your just need to avoid buying at peak competition.
Risks Buyers Should Watch
Interest rate volatility
A 1% rise in mortgage rates can reduce borrowing power by ~10%.
🔸 Local oversupply pockets
Some city‑centre flat markets can become saturated.
🔸 Employment concentration
Areas dependent on one employer or industry carry higher risk.
🔸 Leasehold issues
Ground rents, cladding, service charges — always check.
🔸 Future development plans
Large new schemes can affect views, traffic, and local supply.
Buyer Checklist — Your Decision Framework
✔ 1. Is supply limited in this area?
Planning constraints? Land scarcity? Slow pipelines?
✔ 2. Demand drives!
What is pulling people in? Jobs? Transport? Schools? Regeneration?
✔ 3. Interest rates trajectory?
Rising? Falling? Stable?
✔ 4. What is buyer sentiment like?
Competitive? Quiet? Mixed?
✔ 5. Real‑terms price trend?
Is this a temporary dip or a structural shift?
✔ 6. Can you comfortably afford the mortgage at +2% stress?
Future‑proof your affordability.
Conclusion: Buyers Win When They Understand the System
The UK housing market is not random. It is a system driven by:
- Slow, constrained supply
- Fast‑moving demand
- Interest rate cycles
- Local fundamentals
- Long‑run real‑terms growth
When you understand these forces, you can:
- Buy with confidence
- Negotiate more effectively
- Avoid overpaying
- Choose areas with strong long‑term fundamentals
This guide gives you the framework.
Use it to make a smarter, more informed purchase — not just a hopeful one.