

The Blueprint Advantage: A Core Guide to Rental Markets & returns
The UK rental market outlook for landlords operate at the intersection of rental demand, supply constraints, mortgage costs, and regulation. Understanding these forces — and how they interact — is essential for protecting yield, reducing voids, and making smart long‑term decisions.
Below is a clear, structured UK rental market guide tailored specifically for landlords
Demand: Analysing Tenant Demand: Key Drivers for Rental Growth
Tenant demand is shaped by:
• Local employment (tech, finance, logistics, public sector)
• Transport links (commuter rail, road corridors)
• Schools and amenities
• Affordability relative to nearby markets
What this means for landlords:
High‑demand areas reduce voids, support rent increases, and create stable long‑term occupancy.

The diagram above maps rental demand across the UK by combining official ONS rental‑growth data with real‑time demand indicators from Zoopla and Rightmove. Areas shaded red show where tenant competition is strongest and supply is most constrained — the conditions that typically support faster rent growth, lower voids and stronger long‑run returns. For landlords and investors, this heatmap acts as a national screening tool, highlighting the markets where rental pressure is highest and investment fundamentals are most resilient.
Top UK Cities by Rental Demand & Constrained Supply (Highest → Lowest)
(Based on ONS IPHRP rental growth, Zoopla/Rightmove demand indicators, and DLUHC supply constraints)
1. Oxford
• Extremely low supply elasticity
• High student + professional demand
• Chronic undersupply (HDT failures, green belt constraints)
• One of the strongest rental‑pressure markets in the UK
2. London (Inner London strongest)
• High rental inflation
• Severe supply shortages in many boroughs
• Intense competition for rentals
3. Manchester
• High demand from young professionals + students
• Strong rental growth
• Supply improving but still lagging demand
4. Bristol
• Very tight supply
• High rental inflation
• Strong demand from professionals, students, and relocators
5. Cambridge
• Similar to Oxford: high incomes, low supply, strong demand
• Tech + university drivers
6. Brighton & Hove
• High demand, limited land, strong rental competition
• Tourism + student + commuter demand
7. Reading
• Crossrail effect + London spillover
• Strong rental demand, moderate supply constraints
8. Birmingham
• Strong rental demand
• Supply improving but still tight in central areas
9. Leeds
• High demand from students + professionals
• Supply improving but still lagging in key districts
10. York
• Heritage constraints limit supply
• Strong rental demand and low vacancy rates
Why These Cities Rank Highest
They share the same structural features:
• High rental growth (ONS IPHRP)
• High tenant competition (Zoopla/Rightmove)
• Low new‑build delivery (DLUHC)
• Strong demographic or economic drivers
• Limited land availability or planning constraints
This is the exact combination that produces high rental pressure, low voids, and strong long‑run returns.
How This Helps Landlords & Investors
This ranking helps you:
• Identify high‑pressure rental markets
• Target areas with strong rent growth and low vacancy risk
• Avoid markets where supply is rising faster than demand
• Prioritise cities with structural undersupply, not temporary spikes
• Build a portfolio in locations with resilient long‑run fundamentals
Oxford, London, Bristol, Cambridge and Manchester consistently top the list because they combine high demand with severe supply constraints — the strongest investment conditions.
Supply: The Hidden Driver of Rental Growth
Rental supply (refers to the volume of residential properties available for rent at a specific time in a given market) is shaped by:
• New‑build delivery
• Planning constraints
• Land availability
• Build‑to‑rent competition
• Landlord exit rates (Section 24, regulation, EPC rules)
The rental supply is a key metric representing the inventory of homes offered by landlords to tenants.
Supply vs. Demand:
Rental supply often fails to keep up with demand, causing market imbalances where many tenants compete for few properties.
A tight supply (low inventory) leads to increased competition, rising rents, and lower vacancy rates.
An elastic supply (high inventory) leads to less competition, falling rents, and higher vacancy rates.
Factors Reducing Supply:
- Increased regulation,
- higher taxes for landlords (Section 24),
- rising compliance costs, and
- landlords exiting the sector reduce the supply of available homes.
Factors Increasing Supply:
- New ”build-to-rent” developments,
- investment incentives, or
- homeowners choosing to rent out properties rather than selling can boost supply
Impact of Legislation:
Regulatory changes, like the Renters’ Rights Act and other legislation are transforming the UK rental sector, creating a stronger focus on tenant security, property standards, and professional management, however, the ripple effect can cause Landlords to exit the market, hence a reduction in rental stock.
What this means for landlords:
Low supply = stronger rental growth, higher yields, and more pricing power.
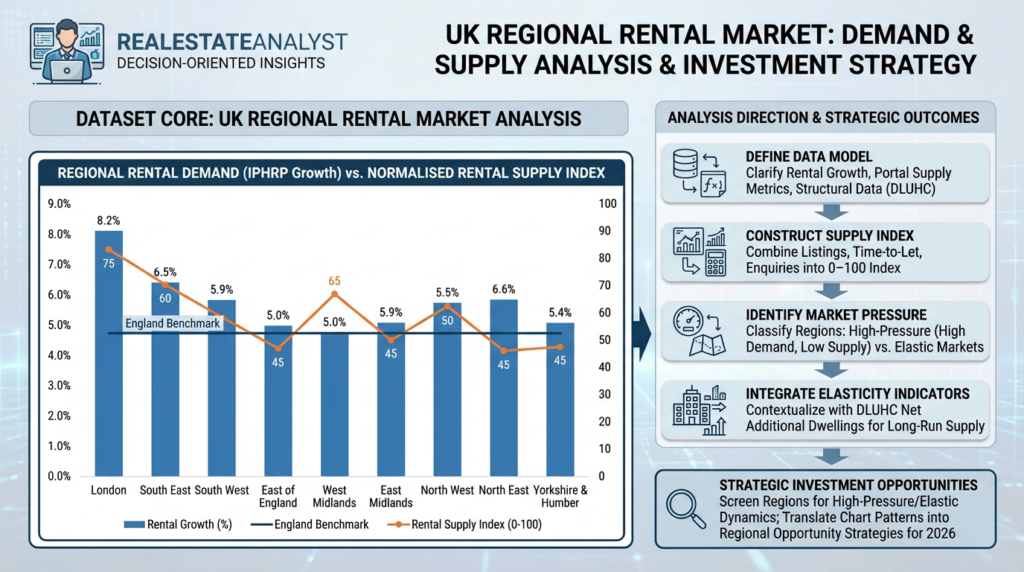
This chart compares rental demand and rental supply across the major English regions using official ONS rental‑growth data and a normalised rental‑supply index derived from portal metrics. The blue bars show year‑on‑year rental growth, while the orange line represent the relative availability of rental stock, scaled from 0 to 100 for easy comparison. A national benchmark line highlights which regions are outperforming the wider market. By combining rental demand, real‑time rental supply, and long‑run structural supply indicators, the chart reveals where tenant competition is strongest, where supply is loosening, and where rental markets are most likely to remain under pressure.
How This Helps Landlords and Investors
Identifies High‑Pressure Rental Markets
Regions with high rental growth and low rental supply signal:
• Strong tenant competition
• Faster rent increases
• Lower void risk
• Higher pricing power
These are typically the most resilient markets for buy‑to‑let investors.
Flags Elastic or Cooling Markets
Regions with high supply and moderate rental growth indicate:
• Softer rent trajectories
• Higher vacancy risk
• Greater competition between landlords
• Need for sharper pricing and asset selection
This helps investors avoid over‑exposed markets.
Distinguishes Short‑Run vs Long‑Run Supply
The chart separates:
• Rental supply (flow) → what’s available today
• Structural supply (DLUHC) → how easily a region can expand housing stock
This distinction is crucial because:
• Tight structural markets (e.g., constrained planning) stay tight for decades
• Elastic markets can absorb demand shocks more easily
Supports Portfolio Allocation Decisions
Investors can use the chart to:
• Prioritise regions with strong fundamentals
• Balance yield vs growth
• Diversify across pressure levels
• Time market entry based on supply shifts
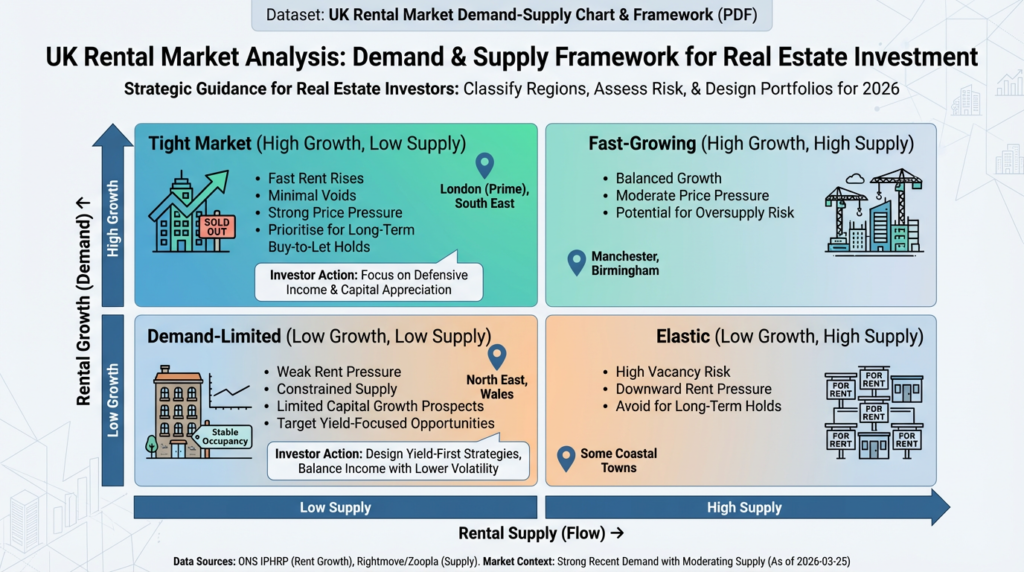
This presents a simple but powerful framework for understanding the UK rental market by mapping each region into one of four quadrants based on two core forces: rental demand (measured by rental growth) and rental supply (measured by available stock).
The vertical axis shows how quickly rents are rising, while the horizontal axis shows how much rental property is coming onto the market. When you combine these two metrics, you get four distinct market conditions:
Tight Markets (high growth, low supply), where rents rise quickly and voids are minimal;
Fast‑Growing Markets (high growth, high supply), where demand is strong but new stock is flowing in;
Demand‑Limited Markets (low growth, low supply), where supply is constrained but demand isn’t strong enough to push rents up; and
Elastic Markets (low growth, high supply), where landlords face higher vacancy risk and weaker pricing power.
This quadrant model helps landlords and investors quickly assess risk, identify resilient regions, and shape portfolio strategy.
Tight Markets favour long‑term holds and defensive income,
Fast‑Growing Markets offer momentum and acquisition opportunities,
Demand‑Limited Markets suit yield‑first strategies, and
Elastic Markets signal caution.
By visualising the balance between demand and supply, the framework turns complex market dynamics into clear, actionable insight for 2026 and beyond
Mortgage Rates: The Fastest Lever Affecting Landlords
Mortgage rates don’t change the number of tenants — but they dramatically change your cash flow, yield, and investment timing.
When rates rise:
• Monthly payments increase
• Net yield compresses
• Landlords with leverage feel pressure
• Some exit the market → supply tightens → rents rise
When rates fall:
• Cash flow improves
• Remortgaging becomes easier
• Portfolio expansion becomes viable
Regulation: The Slow, Structural Force
Landlords face a regulatory environment that evolves slowly but has long‑term consequences:
• EPC requirements
• Section 24 tax changes
• Renters Reform Bill
• Local licensing schemes
• Compliance costs
What this means for landlords:
Regulation shapes long‑run profitability more than short‑term price cycles
Yield & Long‑Run Value: The Landlord’s Core Equation
Landlords must balance:
• Rental yield
• Capital growth
• Operating costs
• Mortgage costs
• Taxation
• Voids
• Maintenance
What this means for landlords:
The best markets combine high rental pressure, low supply elasticity, and strong income growth — exactly the conditions seen in places like Wokingham, Reading, and the wider South East
Landlords operate in a market shaped by fast‑moving mortgage rates and slow‑moving supply constraints. Understanding tenant demand, new‑build delivery, regulation and financing costs is essential for protecting yield and long‑term value.
In tight markets — where rental growth outpaces new supply — landlords benefit from stronger pricing power and lower voids. The key is to read both the short‑term cycle (driven by interest rates) and the long‑term fundamentals (driven by supply, income growth and regulation).
Thinking of investing in a particular city? Get the 2026 Outlook for your specific target city. Register your interest here