

A strategic guide for UK homeowners who want to sell smarter, faster, and for the right price.
Price right and sell fast. However, selling a home isn’t about guessing the “right” price or waiting for the perfect buyer. It’s about understanding the forces that shape buyer behaviour — and positioning your property to take advantage of them.
The UK housing market is driven by one principle:
Your sale price is determined by what buyers are willing and able to pay — not by what you hope to achieve.
This Price Right and Sell Fast Guide will show you how supply, demand, interest rates, and competition influence your sale — and how to use that knowledge to your advantage.
Demand Drives Your Sale Price — Here’s What Actually Moves It
Demand rises when:
- Mortgage rates fall
- Buyer confidence improves
- Employment is strong
- Local amenities and transport links attract movers
- Headlines turn positive
Demand falls when:
- Rates rise
- Affordability weakens
- Lenders tighten criteria
- Economic uncertainty increases
SO WHAT FOR SELLERS?
- Strong demand = faster sales, multiple offers, higher prices.
- Weak demand = longer time on market, price sensitivity, fewer viewings.
- Your pricing strategy must match the demand cycle — not fight it.
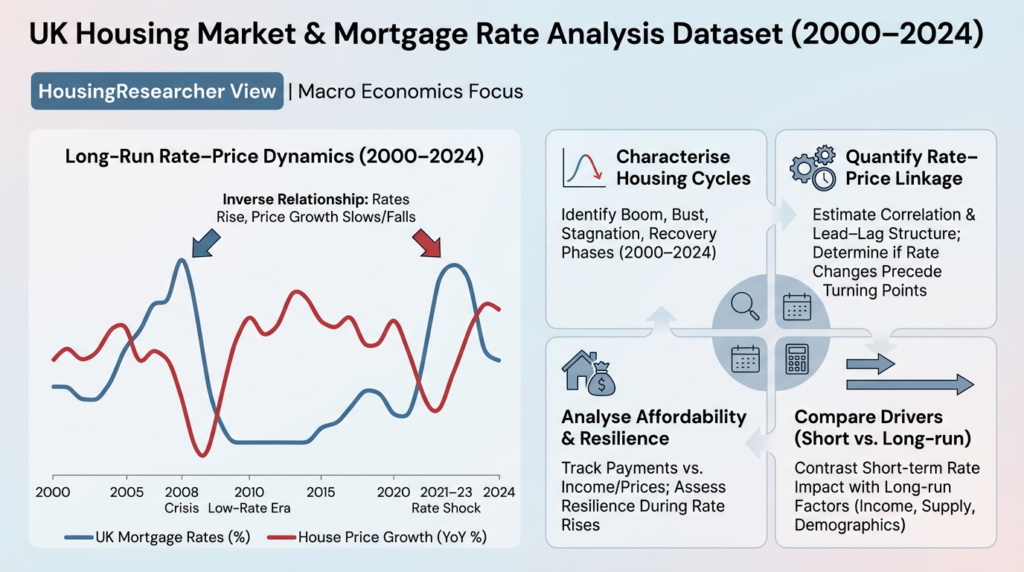
The diagram helps sellers understand why the market speeds up or slows down. When mortgage rates rise, affordability tightens and price growth weakens; when rates fall, demand rebounds and prices recover. By watching these shifts, sellers can time their listing, set realistic expectations, and understand buyer behaviour far more clearly. Interest‑rate cycles explain the short‑term movements in the market — and knowing where we are in the cycle gives sellers a real advantage.
Over the long run, this inverse relationship repeats across every major cycle — from the 2008 crisis to the 2021–23 rate shock — demonstrating that interest rates drive short‑term movements, while deeper structural forces determine the long‑term trend.
Supply = Your Competition — And It Matters More Than You Think
Supply includes:
- Similar homes for sale in your area
- New‑build developments nearby
- Rental stock (affects investor demand)
When supply is low:
- Buyers have fewer options
- Your home stands out
- You can price more confidently
When supply is high:
- Buyers compare aggressively
- Overpricing becomes dangerous
- Time on market increases
SO WHAT FOR SELLERS?
Your competition — not national averages — determines your achievable price.
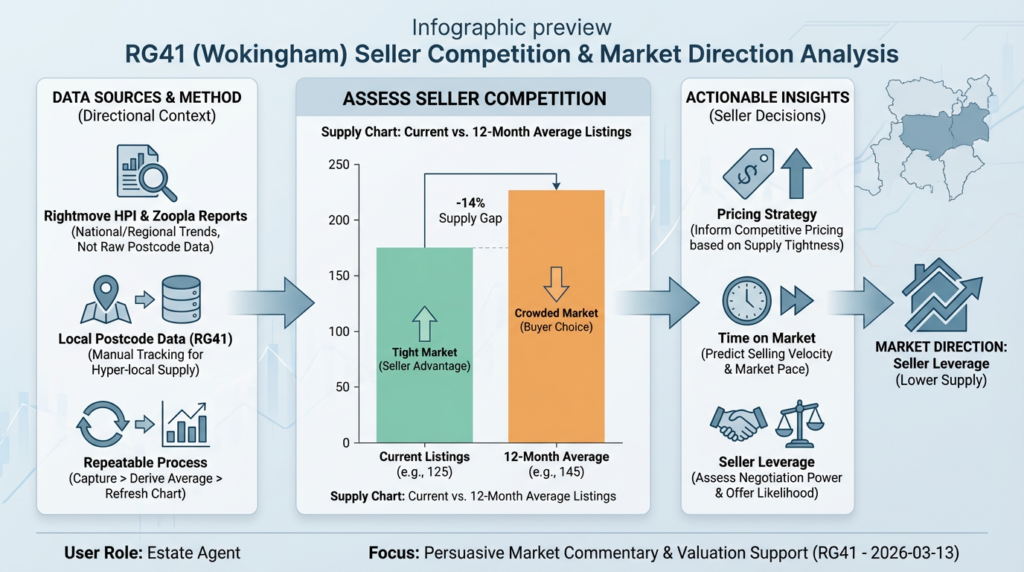
This diagram shows how the current number of homes for sale in RG41 compares with the 12‑month average, giving a quick read on how much competition sellers face. The chart highlights that current listings sit well below the typical annual level, indicating a tight market where sellers have more leverage, stronger pricing power and a higher likelihood of attracting motivated buyers. By contrasting today’s supply with longer‑term norms, the diagram helps homeowners understand whether they’re entering a crowded market or one where limited choice works in their favour.
Market Cycles: Why Timing Your Listing Matters
The UK market moves in cycles driven by interest rates and sentiment.
Favourable selling conditions
• Rates falling or stable
• Rising buyer confidence
• Low local supply
• Strong seasonal periods (March–July, September–October)
Challenging selling conditions
• Rates rising
• Negative headlines
• High local supply
• Winter months (Nov–Jan)
SO WHAT FOR SELLERS?
You don’t need to “time the peak” — you just need to avoid listing when buyer demand is weakest.
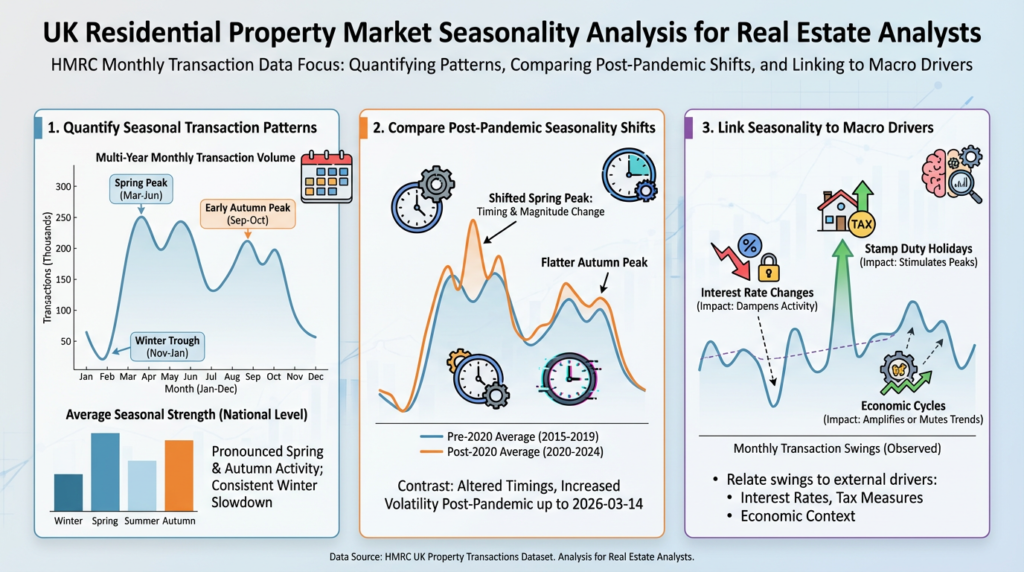
This diagram illustrates how UK property transactions follow a clear seasonal rhythm, with activity typically peaking in spring and again in early autumn before dropping sharply over winter. By comparing pre‑ and post‑pandemic averages, the chart also shows how these patterns have shifted in recent years, with more volatility and altered peak timings. The infographic links these swings to wider economic forces — from stamp duty holidays to interest rate changes — helping readers understand how both seasonal behaviour and macro conditions shape the flow of housing market activity
Pricing Strategy: The Single Most Important Decision You Control
Most sellers overprice.
Most buyers ignore overpriced homes.
Here’s the truth:
A correctly priced home sells faster and for more money than an overpriced home that goes stale.
Price too high →
• Fewer viewings
• Longer time on market
• Price reductions
• Buyers assume “something is wrong”
Price correctly →
• More viewings
• More offers
• Stronger negotiation position
• Faster sale
SO WHAT FOR SELLERS?
Pricing is not about ambition — it’s about positioning.
You want to be the best value in your category, not the most expensive.
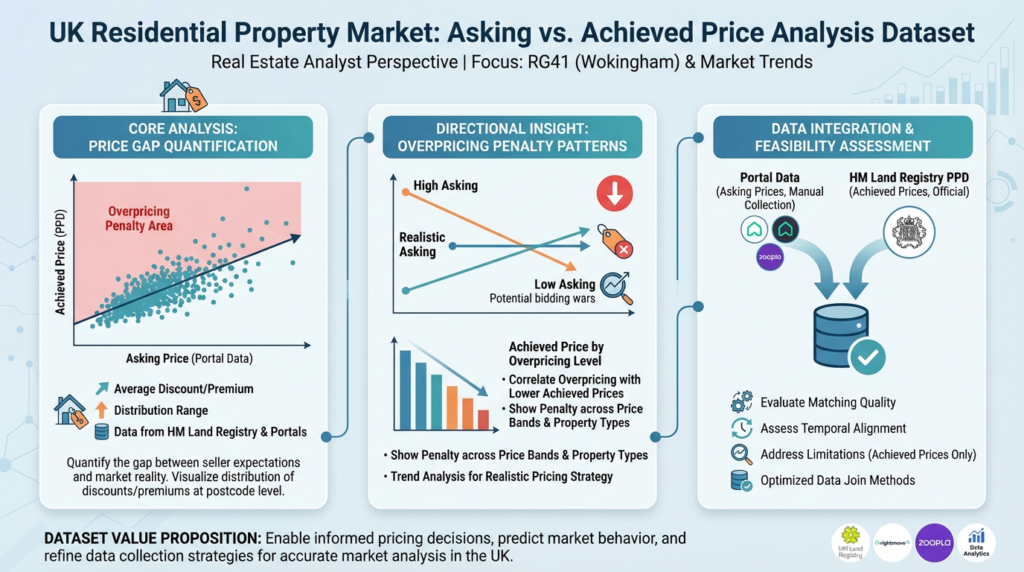
This diagram compares asking prices from property portals with achieved sale prices from HM Land Registry to show how accurately homes are priced in RG41. The scatter plot highlights the ‘overpricing penalty’ — where ambitious asking prices ultimately lead to lower achieved values — while realistic pricing tends to deliver stronger outcomes. By combining portal data with official sold‑price records, the chart reveals how seller expectations align with market reality and why pricing strategy is one of the strongest drivers of final sale performance.
How to Read Buyer Signals — The Clues That Tell You What to Do Next
Strong buyer signals
• Multiple viewings in first 2 weeks
• Early offers
• Buyers asking detailed questions
• Competing interest
→ You are priced correctly or slightly low.
→ Consider holding firm on price.
Weak buyer signals
• Few or no viewings
• No second viewings
• Buyers only asking about price reductions
• Agents reporting “quiet market”
→ You are overpriced relative to competition.
→ Adjust quickly — don’t wait months.
SO WHAT FOR SELLERS?
The market gives you feedback instantly.
Ignoring it costs you money.
When to List — The Optimal Timing Strategy
Best times to list
• Early spring (Feb–May)
• Early autumn (Sept–Oct)
• When rates stabilise or fall
• When local supply is low
Times to avoid
• Late November–January
• Immediately after rate hikes
• When multiple similar homes hit the market
SO WHAT FOR SELLERS?
Timing affects competition.
Competition affects price
How to Avoid Overpricing — A Seller’s Checklist
Compare your home only to similar properties
Same size, condition, location, and style.
✔ Ignore “aspirational” listings
Asking prices are not evidence — sold prices are.
✔ Use a 14‑day rule
If you don’t get strong interest in 2 weeks, adjust.
✔ Price for the market you’re in
Not the market you wish you were in.
✔ Understand buyer psychology
Buyers compare value, not dreams.
✔ Don’t anchor to your purchase price
Markets move — sometimes up, sometimes down.
Seller Checklist — Your Action Plan
✔ 1. Assess local supply
How many similar homes are for sale?
✔ 2. Understand demand
Are rates rising or falling? Are buyers active?
✔ 3. Price strategically
Aim to be the best value in your category.
✔ 4. Watch early signals
Strong interest = good pricing. Weak interest = adjust.
✔ 5. Time your listing
Spring and early autumn outperform.
✔ 6. Prepare your home
Presentation matters more when demand is weak.
Conclusion: Selling Smart Means Understanding the Market, Not Fighting It
Your sale price is shaped by:
• Buyer demand
• Local supply
• Interest rates
• Competition
• Pricing strategy
When you understand these forces, you can:
• Sell faster
• Avoid price reductions
• Maximise your final sale price
• Reduce stress and uncertainty
This guide gives you the framework.
Use it to sell with confidence — and on your terms